Dirty Solar Panels: What PV Soiling Does and When to Clean
Short answer: Dirty solar panels can produce less energy because dust, pollen, soot, bird droppings and other deposits absorb or scatter light before it reaches the cells. The size of the loss is site-specific. It depends on the material, coverage, weather, module angle and time since rain or cleaning, so output data should guide the decision to clean.
In this guide
- What is PV soiling?
- How soiling affects performance
- Why visual inspection is not enough
- When rain may help
- When cleaning is justified
- How to compare cleaning methods
- What to review in a cleaning system
- Where site conditions differ
Key Takeaways
1. Visible is not measured. A photograph can document deposits, but it cannot isolate an energy loss from weather, temperature, curtailment or equipment faults.
2. Rain has no universal result. Some precipitation events remove part of a deposit. Other material can persist, move toward an edge or become more strongly attached.
3. Use a site threshold. Compare recoverable energy with cleaning cost, operational constraints and the next likely natural cleaning event.
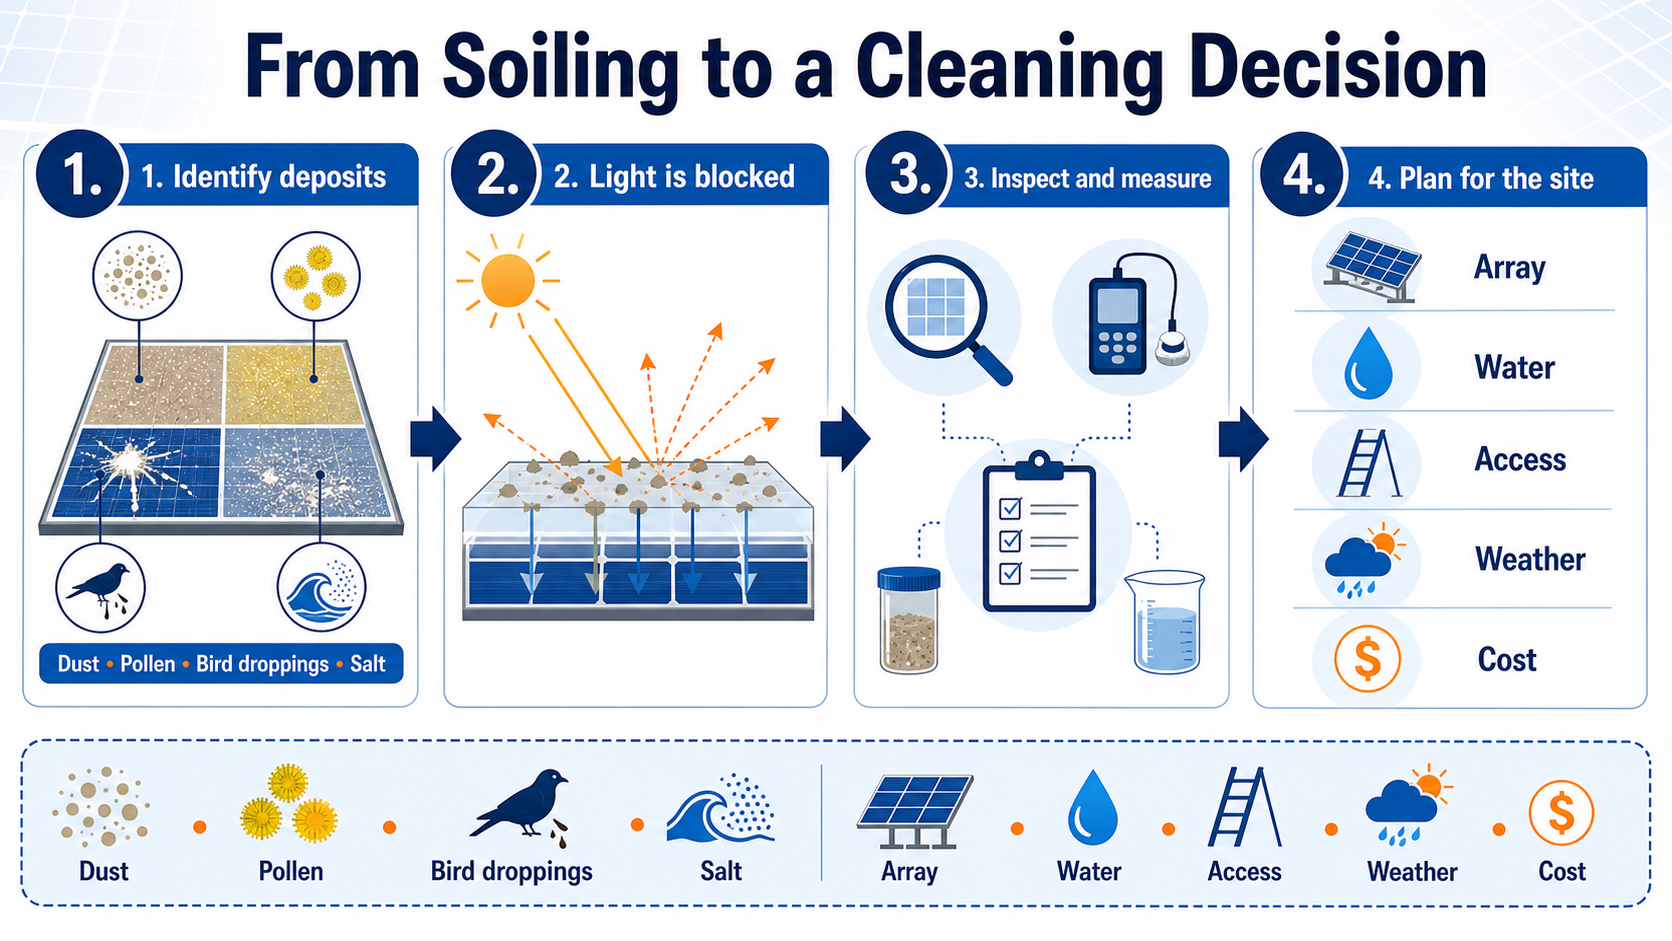
From visible deposits to a site-specific cleaning decision: document the condition, measure the relevant impact and review operational constraints before selecting a cleaning plan.
What Is PV Soiling?
Definition: PV soiling is the accumulation of material on the light-facing surface of a photovoltaic module. Dust, soot, pollen and other particles reduce transmitted light by absorption or scattering. Biological material, bird droppings, mud, salt and site-specific industrial deposits can create different patterns and may require different inspection or removal methods.
"Dirty" is a useful visual description, but "soiling" is the performance term. The same visible coverage can behave differently depending on particle size, chemistry, humidity, module coating, tilt and how evenly the deposit is distributed. A cleaning plan should therefore identify both the deposit and the site conditions before selecting a method.
Common sources include nearby unpaved ground, agriculture, roads, construction, industrial activity, seasonal pollen, birds and wind-blown dust. Dew and humidity may increase adhesion, while wind or precipitation may remove part of some deposits. These effects vary within a region and can also vary between subarrays at one plant.
Common deposits to record during inspection
- Dry dust and fine sand: often linked to wind, unpaved roads or dry ground.
- Pollen and plant material: frequently seasonal and potentially more adhesive after moisture.
- Bird droppings: localized deposits that can create concentrated shading.
- Salt mist and industrial particles: site-specific material that needs a compatible cleaning process.
- Leaves and mud splashes: inspect for drainage, edge accumulation and repeated local sources.
Distribution matters. A thin, relatively even layer behaves differently from a persistent spot or a strip of material collected along the lower module edge. This is one reason a single convenient module or a wide site photograph may not represent an entire array.
Actual BQ series equipment image. The dirt type alone does not determine a cleaning method, equipment configuration or expected recovery.
How Dirty Solar Panels Affect Performance
Performance principle: Soiling reduces the light available for conversion. A relatively even layer mainly creates an optical loss; localized or uneven deposits can add electrical mismatch. The resulting energy effect varies with the deposit, module and system configuration, so a percentage from another site should not be treated as a forecast for the current plant.
Dust, soot and other particles can absorb or scatter plane-of-array irradiance before it enters the module. The complement of fractional soiling loss is commonly described as the soiling ratio: a value of 1 represents the clean reference condition, while a lower value indicates reduced transmission or output relative to that reference.
IEA PVPS notes that soiling can be heterogeneous across a module and across a plant, including greater accumulation near module edges. Non-uniform deposits can create mismatch that a single visual score or poorly located reference device may miss.
Localized deposits can also be relevant to thermal inspection. A photograph cannot diagnose a hotspot. If a site identifies persistent localized shading, abnormal temperature or an unexpected electrical signature, a qualified O&M team should investigate using the plant procedure and module manufacturer guidance.
Avoid generic loss claims. Global or regional averages are useful for understanding the scale of the soiling issue, but they are not a prediction for a specific plant. A project percentage needs its location, time window, clean reference, measurement method, operating state and uncertainty.
Why Visual Inspection Is Not Enough
Visual inspection is useful for finding where deposits occur and how they are distributed. It does not isolate a soiling loss. A stronger assessment compares matched clean and soiled references, uses a qualified soiling sensor, or analyzes normalized plant performance while accounting for irradiance, temperature, outages, curtailment and degradation.
| Method | What it can answer | Main limitation | Best use |
|---|---|---|---|
| Visual inspection | Where deposits occur and whether they are uniform | Does not quantify energy loss; affected by lighting and viewing angle | Routine inspection and sample selection |
| Before-and-after photo | How a surface changed during a documented event | Does not prove energy recovery or a long-term result | Work-order and condition records |
| Plant performance trend | Whether output differs from a corrected expectation | Requires treatment of weather, temperature, outages, curtailment and degradation | Asset-level trend analysis |
| Clean/soiled reference pair | A relative cleanliness condition or soiling ratio | Representativeness, maintenance and non-uniform deposits affect the result | Threshold-based site monitoring |
| Optical soiling sensor | Local transmission or contamination change | A sensor location may not represent the full plant | One input in a multi-point monitoring plan |
| I-V or thermal investigation | Whether an electrical or thermal anomaly needs action | Requires qualified personnel, appropriate equipment and a safety procedure | Diagnosis of localized abnormalities |
Actual DQ series equipment image. Use visual evidence to decide where to measure, then combine measured condition, energy value, weather and cleaning cost in the site threshold.
When Rain May Help—and When It May Not
Rainfall boundary: Rain can remove part of some loose deposits, but it is not a guaranteed cleaning event. The outcome depends on rainfall amount and intensity, deposit chemistry, humidity, module angle, drainage and the time since the deposit formed. Compare the site condition before and after rain instead of assuming either complete cleaning or no effect.
Sandia PVPMC notes that some soiling can be cleaned naturally by precipitation while other material requires active removal. Rainfall-based models therefore use local assumptions and detected cleaning events; they do not establish one rainfall threshold for every site.
Water can also redistribute material. Lower-edge accumulation, dried residue or persistent localized deposits may remain after a rain event. A site should inspect representative areas and review measured performance before resetting the soiling condition to "clean."
Treat rain as an observed event
- Record rainfall timing, amount and intensity where data are available.
- Compare representative surfaces rather than one convenient module.
- Check lower edges and persistent localized deposits.
- Review the soiling or normalized performance trend.
- Account for the next dry period before scheduling paid cleaning.
How to Decide When Cleaning Is Justified
Clean when the expected value of recoverable energy and risk reduction under the site's operating plan is greater than the full cost and constraints of cleaning. The threshold should use local measurements, tariff or energy value, weather outlook, access, labor, water, equipment, downtime and module requirements.
| Decision input | What to record | Why it matters | Next action |
|---|---|---|---|
| Deposit | Type, coverage, uniformity and persistence | Affects measurement representativeness and method selection | Identify before comparing methods |
| Measured condition | Soiling ratio, corrected output or another site metric | Separates visible condition from a quantifiable effect | Set and review the threshold |
| Weather | Rain, wind, humidity, dust events and forecast | May add, move or remove deposits | Avoid conflict with likely natural cleaning |
| Array | Tilt, layout, edges, gaps and tracker state | Affects accumulation, access and equipment movement | Assess by representative zone |
| Access and safety | Roof, walkways, work scope and qualified personnel | Determines feasibility and project risk | Use the site safety procedure |
| Water and waste | Source, quality, drainage and discharge limits | Sets boundaries for a wet process | Check module and environmental requirements |
| Economics | Energy value, cleaning cost, downtime and frequency | Determines whether the trigger is commercially rational | Use a transparent cost model |
There is no universal interval for every PV plant. Use the site-specific cleaning cost method to compare recoverable energy with labor, equipment, water, access, downtime and maintenance inputs.
How to Compare Solar Panel Cleaning Methods
Select a method only after confirming the contaminant, module manufacturer limits, array geometry, access, water conditions, required operating mode and safety plan. "Dry," "wet," "handheld" and "robotic" describe different aspects of a cleaning setup; they are not interchangeable performance claims.
Dry cleaning
Uses no process water during the cleaning pass. Compare particle abrasiveness, brush or contact material, dust control, humidity, module coating requirements and the risk of moving grit across the surface.
Wet cleaning
Uses water or an approved fluid to loosen and remove deposits. Confirm water quality, temperature limits, pressure, drainage, environmental controls and the exact module manufacturer instructions before use.
Handheld or operator-assisted
Keeps an operator directly involved in positioning or movement. Compare reach, carrying, roof access, fall protection, cable or hose management and process repeatability.
Robotic equipment
Uses a machine for part or all of the movement and cleaning pass. Confirm whether it is remote-controlled, assisted or automated, then verify dimensions, row transitions, slope, gaps, obstacles and recovery procedures.
This comparison is educational. It does not confirm that a cleaning method or Westrong product is suitable for a particular array. Final suitability requires site data, module requirements and engineering review.
What to Review in an Automated Cleaning System
A solar panel cleaning robot is a system, not just a brush. Its movement method, cleaning head, power, controls, sensing and emergency-stop arrangements must be reviewed against the actual array and operating procedure.
Ask for a model-specific configuration instead of assuming every robotic system has the same functions. The confirmed equipment review should identify the drive and guidance method, brush/contact material, power arrangement, controls, safety functions, working envelope and recovery procedure.
- Frame and drive: confirm how the equipment is supported and moves across the intended PV layout.
- Brush or cleaning head: confirm material, width, contact settings and the compatible cleaning process.
- Power and controls: confirm the operating mode, charging or battery plan and remote-control boundary where applicable.
- Sensors and safety controls: confirm the documented edge, movement, stop and recovery provisions for the proposed configuration.
Do not label a system as fully autonomous, water-free or suitable for every slope based on a product image. Those are model- and site-specific conclusions that require confirmed specifications and engineering review.
Where PV Soiling and Cleaning Conditions Differ
A desert solar farm, an industrial rooftop, a distributed PV station and an agricultural array can all experience different deposits, access constraints and operating windows. Start with the site condition rather than a generic equipment label.
| PV environment | Conditions to inspect | Equipment review focus |
|---|---|---|
| Utility-scale solar farm | Dust events, row length, terrain, access roads, charging and operating windows | Array coverage, transport, support process and safe recovery |
| Commercial or industrial rooftop | Roof access, fall-protection plan, slopes, obstructions, gaps and equipment handling | Geometry, handling, operator role and site safety procedure |
| Distributed PV | Site-to-site variation, compact access, local shade and available operating time | Practical deployment sequence and configuration fit |
| Agricultural or special-structure PV | Structure, ground conditions, seasonal contamination and access restrictions | Project-specific engineering review before any product recommendation |
Related Equipment to Compare
If site measurements justify cleaning, compare equipment by operating method, array geometry, contaminant, access and water conditions. These category links are starting points, not final product recommendations.
BQ Series for Rooftop Arrays
Compare BQ series configurations where brush width, panel slope, gaps, obstacles and equipment handling need to be reviewed for a commercial rooftop. Compare BQ series →
DQ Series for Compact Layouts
Compare compact DQ series equipment after confirming panel dimensions, row access, slope, obstacles and the required operating method. Compare DQ series →
JR Series for Solar Farms
Compare JR series equipment for ground-mounted PV projects after confirming terrain, array geometry, transport, charging and operational support requirements. Compare JR series →
LM Gantry Cleaning Systems
Compare LM gantry systems for large-format cleaning workflows after confirming clearance, panel geometry, access, work area and site safety requirements. Compare LM systems →
Final suitability requires confirmed site data and engineering review. You can also compare all solar panel cleaning equipment.
Frequently Asked Questions About Dirty Solar Panels
Do dirty solar panels produce less energy?
They can. Deposits absorb or scatter part of the light before it reaches the solar cells. The actual energy effect depends on the deposit, coverage, module and weather, so a site measurement is more useful than applying a generic percentage.
Does cleaning solar panels make a difference?
Cleaning can make a measurable difference when soiling is causing a recoverable loss. Compare a qualified clean reference, soiling measurement or normalized performance before and after the event. A cleaner-looking surface alone does not prove a specific energy recovery.
Does cleaning solar panels improve performance?
It can improve performance relative to the soiled condition, but only the recoverable soiling component should be attributed to cleaning. Irradiance, temperature, outages, curtailment, shading, degradation and faults must be separated from the comparison.
Is rain enough to clean solar panels?
Sometimes rain removes part of a loose deposit; sometimes material remains or moves toward module edges. Rainfall amount, deposit chemistry, humidity, tilt and drainage all matter. Inspect and measure the site after rain rather than treating every rain event as a complete cleaning.
How often should solar panels be cleaned?
There is no universal schedule. Set a site threshold using measured soiling or normalized performance, energy value, cleaning cost, weather outlook, access, water, equipment and the module manufacturer's requirements. Review the threshold after major dust or weather events.
Review more solar panel cleaning robot FAQs →
Sources and Technical Review
This guide summarizes site-based measurement and cleaning-decision principles. It does not replace the applicable PV monitoring standard, the module manufacturer's cleaning instructions, the plant O&M procedure or a project-specific safety assessment.
- IEA PVPS Task 13, Soiling Losses — Impact on the Performance of Photovoltaic Power Plants, 2023.
- IEA PVPS Tasks 13 and 16, Understanding, Measuring, and Mitigating Soiling Losses in PV Power Systems, 2025.
- Sandia National Laboratories PV Performance Modeling Collaborative, Soiling Losses.
- National Renewable Energy Laboratory, Photovoltaic Module Soiling Map.
- IEA PVPS Task 16, Best Practices Handbook for the Collection and Use of Solar Resource Data, Fourth Edition, 2024.
Review Your Site Conditions
Share the site type, array layout, module dimensions, access, contamination, water conditions and preferred operating method. The project team can then discuss relevant standard or custom equipment paths.
Send Site Requirements | Review Cleaning Cost Inputs
Final suitability, specifications, delivery and support scope are subject to engineering and commercial confirmation.
Westrong Robotics · Solar panel cleaning equipment and project configuration